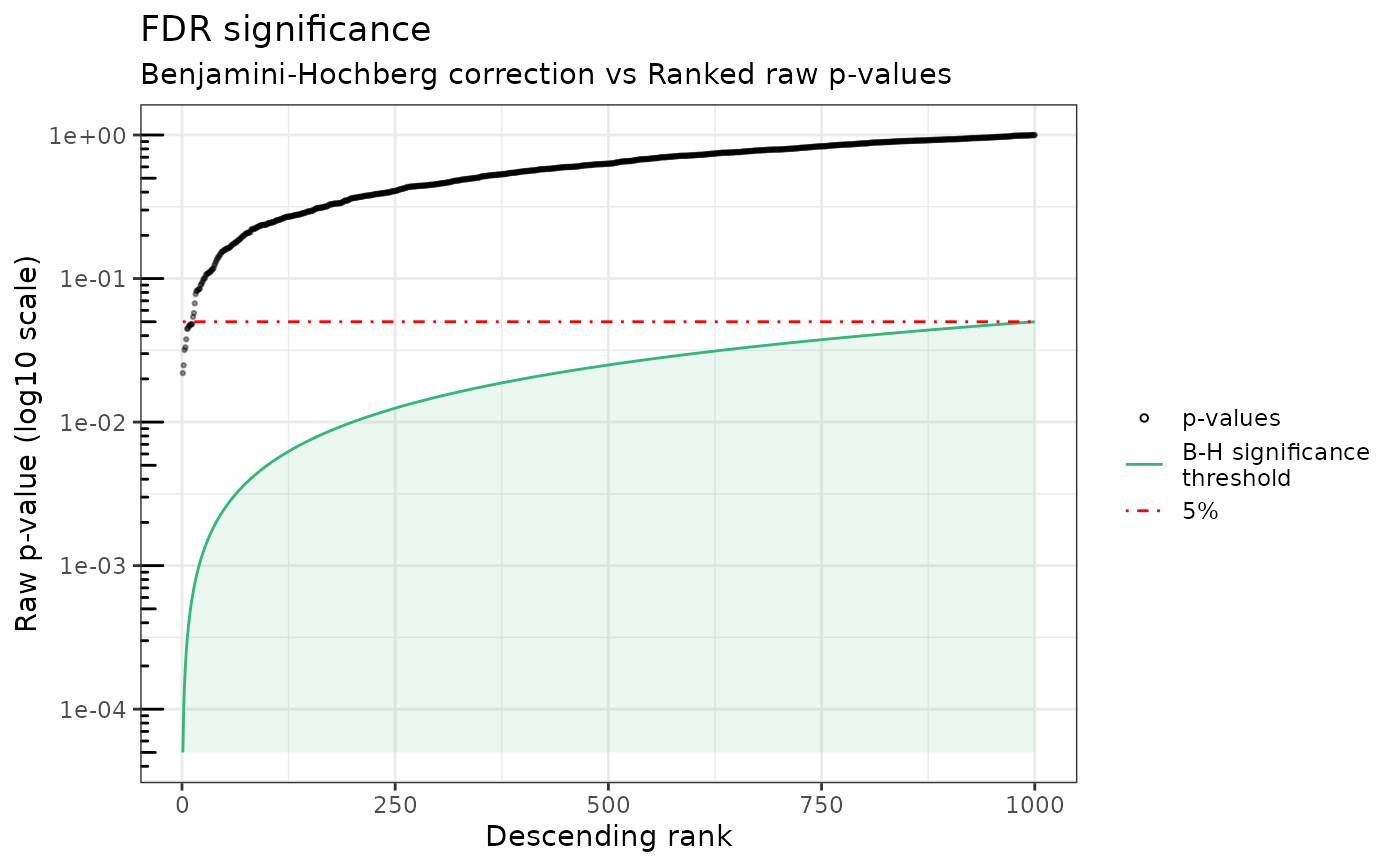
This function prints the sorted exact p-values along with the Benjamini-Hochberg limit and the 5
Examples
#generate fake data
n <- 1000 #number of genes
nr=5 #number of measurements per subject (grouped data)
ni=50 #number of subjects
r <- nr*ni #number of measurements
t <- matrix(rep(1:nr), ni, ncol=1, nrow=r) # the variable to be tested
sigma <- 0.5
x <- matrix(1, ncol=1, nrow=r) #no covariates only intercept
y.tilde <- rnorm(r, sd = sigma)
y <- t(matrix(rnorm(n*r, sd = sqrt(sigma*abs(y.tilde))), ncol=n, nrow=r) +
      matrix(rep(y.tilde, n), ncol=n, nrow=r))

#Run dear_seq()
res_genes <- dear_seq(exprmat=y, covariates=x, variables2test=t,
                   sample_group=rep(1:ni, each=nr),
                   which_test = "asymptotic",
                   which_weights='none', preprocessed=TRUE)

#Plot
plot_ord_pvals(res_genes$pvals$rawPval)