This function computes an approximation of the variance component test based
on the asymptotic distribution of a mixture of \(\chi^{2}\)s using the saddlepoint
method from pchisqsum, as per Chen & Lumley 20219 CSDA.
Arguments
- y
a numeric matrix of dim
g x ncontaining the raw or normalized RNA-seq counts for g genes fromnsamples.- x
a numeric design matrix of dim
n x pcontaining thepcovariates to be adjusted for- indiv
a vector of length
ncontaining the information for attributing each sample to one of the studied individuals. Coerced to be afactor.- phi
a numeric design matrix of size
n x Kcontaining theKlongitudinal variables to be tested (typically a vector of time points or functions of time)- w
numeric matrix of dim
G x ncontaining the weights for G genes from thensamples, corresponding to the inverse of the diagonal of the estimated covariance matrix of y.- Sigma_xi
a matrix of size
K x Kcontaining the covariance matrix of theKrandom effects corresponding tophi.- genewise_pvals
a logical flag indicating whether gene-wise p-values should be returned. Default is
FALSEin which case gene set p-value is computed and returned instead.- homogen_traj
a logical flag indicating whether trajectories should be considered homogeneous. Default is
FALSEin which case trajectories are not only tested for trend, but also for heterogeneity.- na.rm
logical: should missing values (including
NAandNaN) be omitted from the calculations? Default isFALSE.
Value
A list with the following elements when the set p-value is computed:
set_score_obs: the approximation of the observed set scoreset_pval: the associated set p-value
or a list with the following elements when gene-wise p-values are computed:
gene_scores_obs: vector of approximating the observed gene-wise scoresgene_pvals: vector of associated gene-wise p-values
References
Chen T & Lumley T (2019), Numerical evaluation of methods approximating the distribution of a large quadratic form in normal variables, Computational Statistics & Data Analysis, 139:75-81.
Examples
set.seed(123)
##generate some fake data
########################
n <- 100
r <- 12
t <- matrix(rep(1:(r/4)), 4, ncol=1, nrow=r)
sigma <- 0.4
b0 <- 1
#under the null:
b1 <- 0
#under the alternative:
#b1 <- 0.5
y.tilde <- b0 + b1*t + rnorm(r, sd = sigma)
y <- t(matrix(rnorm(n*r, sd = sqrt(sigma*abs(y.tilde))), ncol=n, nrow=r) +
matrix(rep(y.tilde, n), ncol=n, nrow=r))
x <- matrix(1, ncol=1, nrow=r)
#run test
asymTestRes <- vc_test_asym(y, x, phi=cbind(t, t^2),
w=matrix(1, ncol=ncol(y), nrow=nrow(y)),
Sigma_xi=diag(2), indiv=1:r, genewise_pvals=TRUE)
plot(density(asymTestRes$gene_pvals))
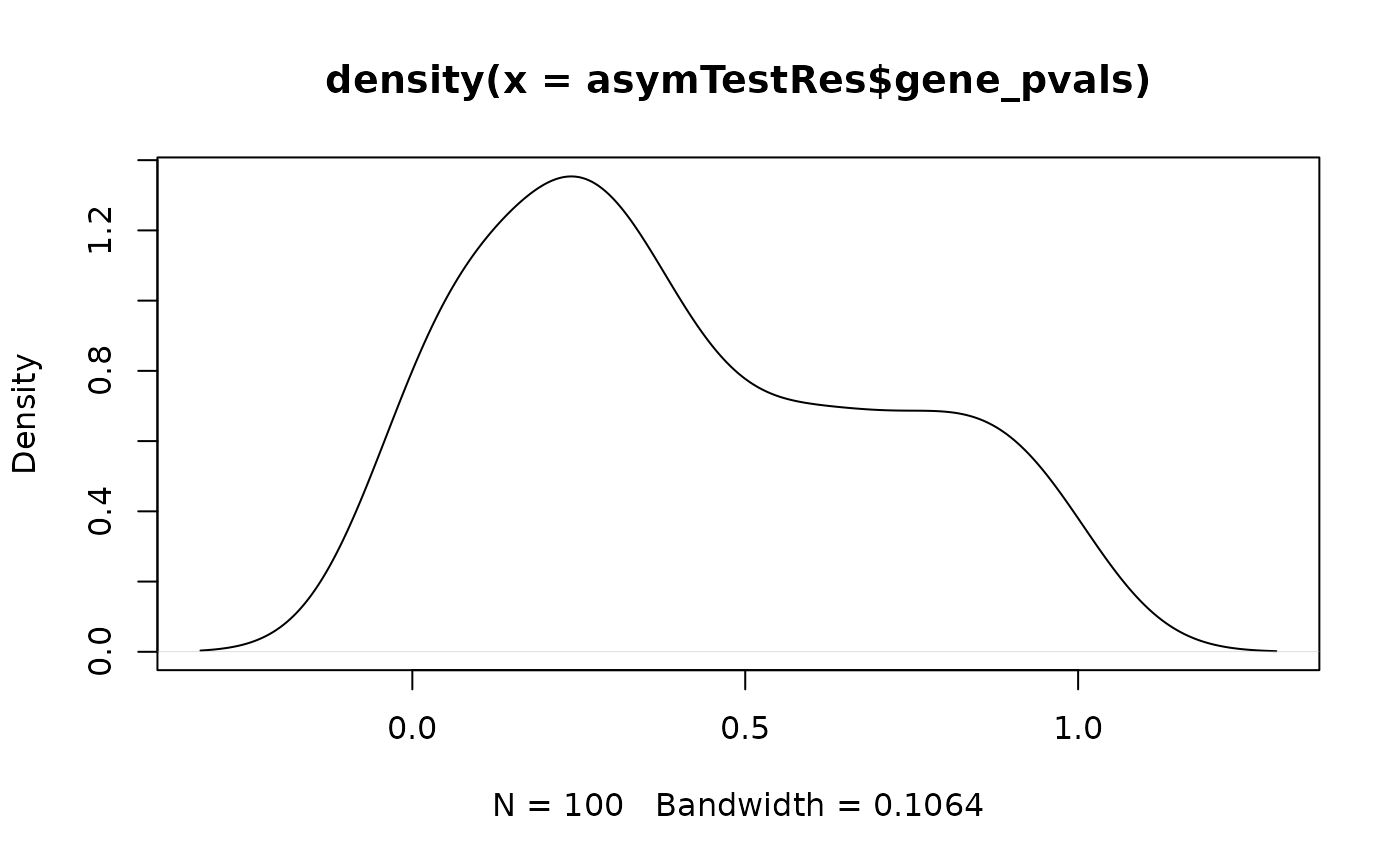 quantile(asymTestRes$gene_pvals)
#> 0% 25% 50% 75% 100%
#> 0.0009203156 0.1781485954 0.3160782864 0.6375846661 0.9785602303
quantile(asymTestRes$gene_pvals)
#> 0% 25% 50% 75% 100%
#> 0.0009203156 0.1781485954 0.3160782864 0.6375846661 0.9785602303